The 2025 Quota Report: Commercial Kangaroo Harvest South Australia was released to the public on 6 January 2025. The South Australian Department for Environment and Water wants the public to believe that after 50 years of commercial harvest, at least 3 severe long-term droughts and a significant decrease in rainfall since 1970, Red Kangaroo numbers are now the highest on record across most of South Australia. Government figures suggest that the number of Red Kangaroos has increased from 1,178,888 in 2020 to 2,975,551 in 2024 – a biologically impossible increase of 152% in 4 years. The statewide population estimate and the commercial “kill” quota are now the highest on record.
South Australia is driving the Red Kangaroo to extinction and hiding the fact by creating record-breaking population estimates. The annual harvest of Red Kangaroos has declined by 80% since the mid-1990’s. The 80% decline in the annual harvest DOES NOT suggest record-breaking numbers.

The record-breaking Red Kangaroo population estimates reported by the South Australian Department for Environment and Water in the 2025 Quota Report are biologically impossible, especially as rainfall since the year 2000 has been below average to the lowest on record in many parts of South Australia.
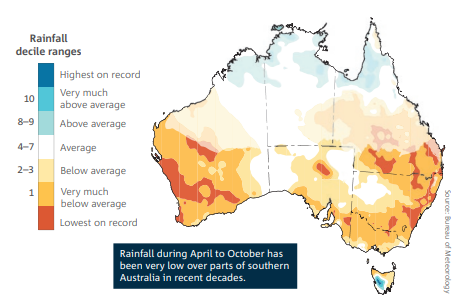
Newsome (1966) showed that drought-induced shortage of forage caused a graded response by Red Kangaroos in central Australia. After 2 months of summer drought, half the young had died in the pouch. After 4 months, half the adult females had ceased breeding. Myers et al. (1976) confirmed his observations during a drought in New South Wales. Pople et al. (2023) indicated that ‘kangaroos take many years to recover (Caughley 1987). There is an upper physiological limit to the modest rate of increase of large herbivores but no limit to their rate of decline in drought.’
The ‘boom and bust’ population cycle is a myth. Kangaroos are a ‘bust’ species, but they take many years to recover after drought.
The 2024 density of Red Kangaroos in Kingoonya is 11.60 – that means there are 11.60 Red Kangaroos per square kilometre in the Kingoonya harvest zone. One of the flaws with kangaroo population estimates is the false assumption that kangaroo numbers are exactly the same in every square kilometre of a harvest zone – and will be exactly the same for an entire year. The 2025 Quota Report: Commercial Kangaroo Harvest South Australia published by the Department for Environment and Water explains that the uncertainty of population estimates is due to the patchy nature of kangaroos in the landscape. Even though everyone knows that kangaroo numbers fluctuate wildly, the assumption is made that the number of kangaroos in a square kilometre will be exactly the same across the entire harvest zone for every single day of the year. Ridiculous!
Back to the Kingoonya harvest zone: The 2024 density of Red Kangaroos in Kingoonya is 11.60 – that means there are 11.60 Red Kangaroos per square kilometre in the Kingoonya harvest zone. The average long-term density (as of 2023) is 4.80. The density of 11.60 is the highest on record – and more than double the long-term average. The population estimate increased from 354,319 in 2020 to 841,531 in 2024. The 2024 population estimate is the highest on record, which means that the 2025 commercial “kill” quota is the highest on record.
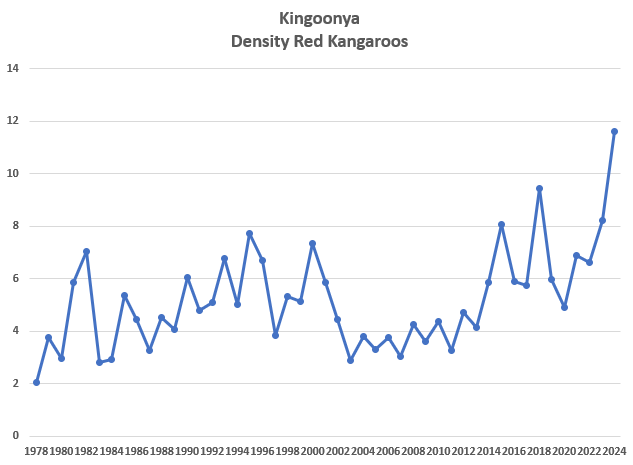
After the 2017-2020 drought, Red Kangaroos reached the highest density on record within 4 years – a density 142% greater than the long-term average. Such a quick, massive, record-breaking recovery post-drought is impossible.
Cairns and Grigg (1993) recorded the density in Kingoonya for the period of 1978 to 1988 as 5.07 Red Kangaroos per square kilometre. The Department for Environment and Water claims that the density has more than doubled since population estimates were first recorded in 1978. Three major droughts (one lasting a decade), 50 years of commercial harvest and below average rainfall since 2000 – yet the population estimate is now 142% greater than the long-term average. The 2022 annual harvest was half the 2012 annual harvest. The annual harvest has declined by 50% since 2012 – yet the population estimate is now the highest on record.
The 2024 density of Red Kangaroos in the North Flinders harvest zone is 18.20. The average long-term density (as of 2023) is 7.04. The density of 18.20 is the highest on record – and more than double the long-term average. The population estimate increased from 165,493 in 2021 to 630,120 in 2024 – an increase of 281% in 3 years.
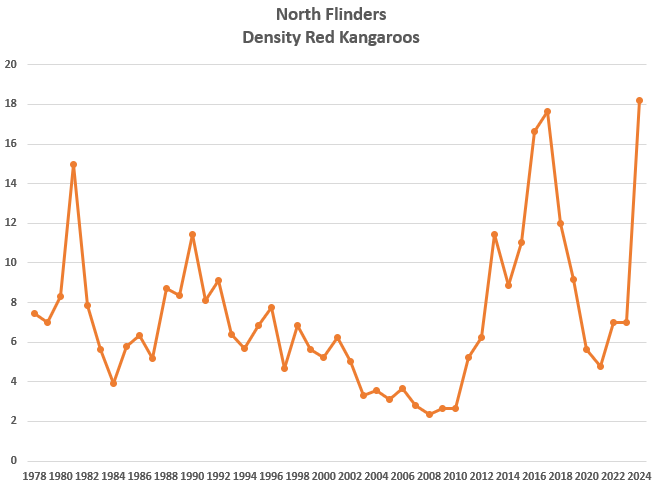
Cairns and Grigg (1993) recorded the density in North Flinders for the period of 1978 to 1988 as 7.55 Red Kangaroos per square kilometre. The Department for Environment and Water claims that the density has almost tripled since population estimates were first recorded in 1978. Three major droughts (one lasting a decade), 50 years of commercial harvest and below average rainfall since 2000 – yet the population estimate is now 158% greater than the long-term average. The 2022 annual harvest was half the 2012 annual harvest. The annual harvest has declined by 50% since 2012 – yet the population estimate is now the highest on record.
The 2024 density of Red Kangaroos in the North-East Pastoral harvest zone is 23.00. The average long-term density (as of 2023) is 10.45. The density of 23.00 is the highest on record – and more than double the long-term average. The population estimate increased from 128,937 in 2020 to 723,304 in 2024 – an increase of 461% in 4 years.
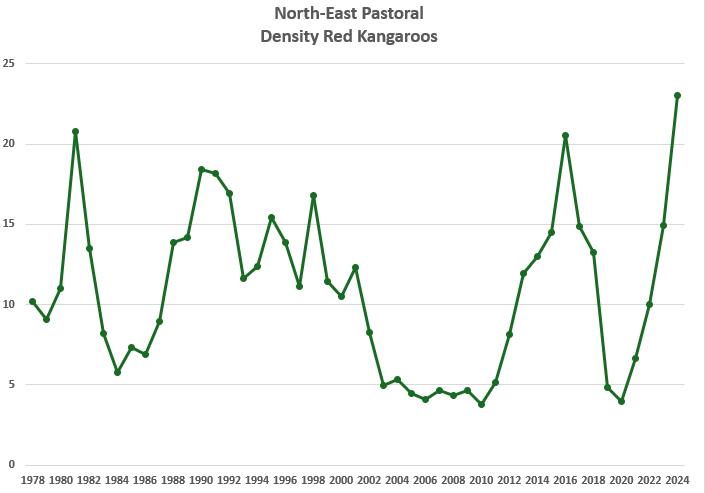
Cairns and Grigg (1993) recorded the density in the North East Pastoral for the period of 1978 to 1988 as 11.32 Red Kangaroos per square kilometre. The Department for Environment and Water claims that the density has doubled since population estimates were first recorded in 1978. Three major droughts (one lasting a decade), 50 years of commercial harvest and below average rainfall since 2000 – yet the population estimate is now 120% greater than the long-term average. The 2022 annual harvest was half the 2013 annual harvest. The annual harvest has declined by 50% since 2013 – yet the population estimate is now the highest on record.
The density of Red Kangaroos in the North East Pastoral harvest zone was 4.10 in 2020. The density had reached low population threshold one, which meant that the quota had to be reduced to 10% for 2020 and 2021. Miraculously, in 4 years, the density increased from 4.10 to 23.00. In 4 years, the density went from the second lowest on record to the highest on record.
The density of Red Kangaroos in the Eastern Districts is now 5.00. The average long-term density (as of 2023) is 2.56. The density of 5.00 is the second highest on record. A density of 5.29 was recorded in 1990. A density of 5.00 is double the long-term average. The population estimate increased from 35,541 in 2020 to 120,090 in 2024 – an increase of 238% in 4 years.
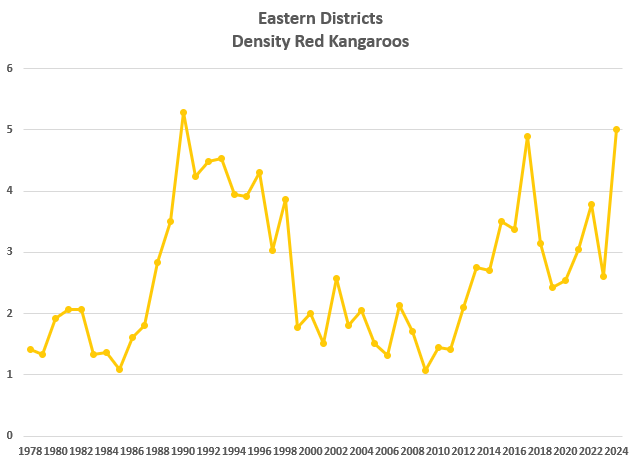
Cairns and Grigg (1993) recorded the density in the Eastern Districts for the period of 1978 to 1988 as 2.58 Red Kangaroos per square kilometre. The Department for Environment and Water claims that the density has doubled since population estimates were first recorded in 1978. Three major droughts (one lasting a decade), 50 years of commercial harvest and below average rainfall since 2000 – yet the population estimate is now 95% greater than the long-term average. The annual harvest peaked in 2015, then declined by 163% for the 2022 harvest.
The density of Red Kangaroos in the South Flinders is now 13.30. The average long-term density (as of 2023) is 4.03. The density of 13.30 is the highest on record – and more than triple the long-term average. The population estimate increased from 43,520 in 2021 to 158,057 in 2024 – an increase of 263% in 3 years.
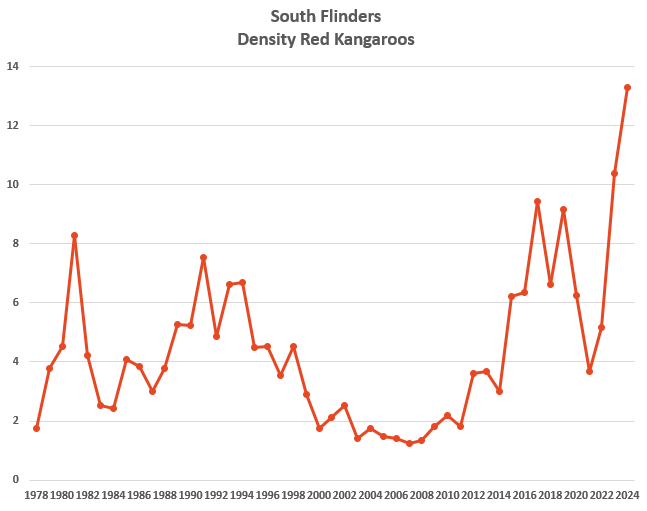
The South Flinders harvest zone was expanded in 2015. The annual harvest peaked in 2019, then declined by 178% for the 2022 annual harvest.
The 2025 Quota on Red Kangaroos is 608,500 – the highest on record. Let’s put these figures into perspective. In 1995, the population estimate for Red Kangaroos was 2,233,164, the quota was 296,800 and the actual harvest was 276,492. In 2024, the population estimate for Red Kangaroos was 2,019,168, the quota was 373,400 and the predicted harvest is 63,823. The population estimate and quota are now the highest on record – yet the number of Red Kangaroos killed is only 23% of the 1995 total. The annual harvest has declined by almost 80%. Such a massive decline in the harvest suggests declining Red Kangaroo numbers – not the highest population estimates on record.
South Australian population estimates are so inaccurate that the commercial harvest of kangaroos cannot be described as sustainable. We simply do not know how many kangaroos are in any of the harvest zones. The only thing we can be sure of is that the annual harvest has declined by 80% since the mid-1990’s, which implies a massive reduction in kangaroo numbers. Record-breaking population estimates are on paper only. The reality is very different – an 80% reduction in the annual harvest, despite the SA Government throwing money at employment opportunities and numerous projects to try to increase the harvest. Nothing works. The harvest has declined by 80% and no amount of money from the government changes this fact. If only the SA Government would admit that the massive reduction in the annual harvest is due to a massive decline in kangaroo numbers. Instead, record-breaking population estimates (on paper only) risk the future of Red Kangaroos in regional South Australia.
https://ro.uow.edu.au/cgi/viewcontent.cgi?article=1571&context=asj
https://www.publish.csiro.au/WR/WR22130
http://www.bom.gov.au/climate/current/annual/sa/archive/2019.summary.shtml
https://www.kangaroosatrisk.org/biology.html
https://www.publish.csiro.au/wr/CWR9660187
https://espace.library.uq.edu.au/view/UQ:9786
https://www.publish.csiro.au/WR/pdf/WR22130
The Effect Of Drought On Kangaroo Populations – UQ eSpace
2025-Quota-Report-for-Commercial-Harvest-of-Kangaroos-for-South-Australia.pdf
